Introducing an innovative credit card statement app, transforming how users manage their expenditures with unparalleled efficiency. With the overwhelming complexity of financial transactions and statements, this solution simplifies the tracking process, empowering users with seamless insights into their spending habits. By revolutionizing the way users interact with their finances, this app aims to streamline financial management, paving the way for a more organized and informed approach to personal finance.
Role
UX/UI Designer of this
personal case study project
Outcome
Banking app design
Timeline
March 2022 - 1 week
Tools
Figma, Illustrator,
Miro, InDesign
Challenge
Credit card statements are a part of almost all of our lives. At certain times each month, we track our expenditures for the past month. But can we do this in the most efficient way?
Unfortunately, today's credit card statements are not user friendly.
It contains a lot of information in very small text and it is very difficult to follow.
The articles overlap, we cannot filter the information we need, it is very possible that we missed something.
Process
Insights:
● People have trouble finding what they are looking for and reading statements.
● The difference between the establishment names of the brands and the names used causes conflict.
● The lines are intertwined.
● The location on the statements is not clear enough, sometimes even wrong.
● They are very formal documents and they are not user friendly.
● People compare how much they spend on each category and then plan their next month.
● They are not conveniently divided into categories.
● Since the extracts are not sufficient, additional applications are used.
Needs:
● To find what they are looking for comfortably
● To see the used names.
● Opening page in application instead of PDF.
● To distinguish easily from previous months.
● To have categories.
● To be no needed for extra apps.
● Spendings separated by names.
● To be able to see the location easily.
● To be able to search.
How might we…
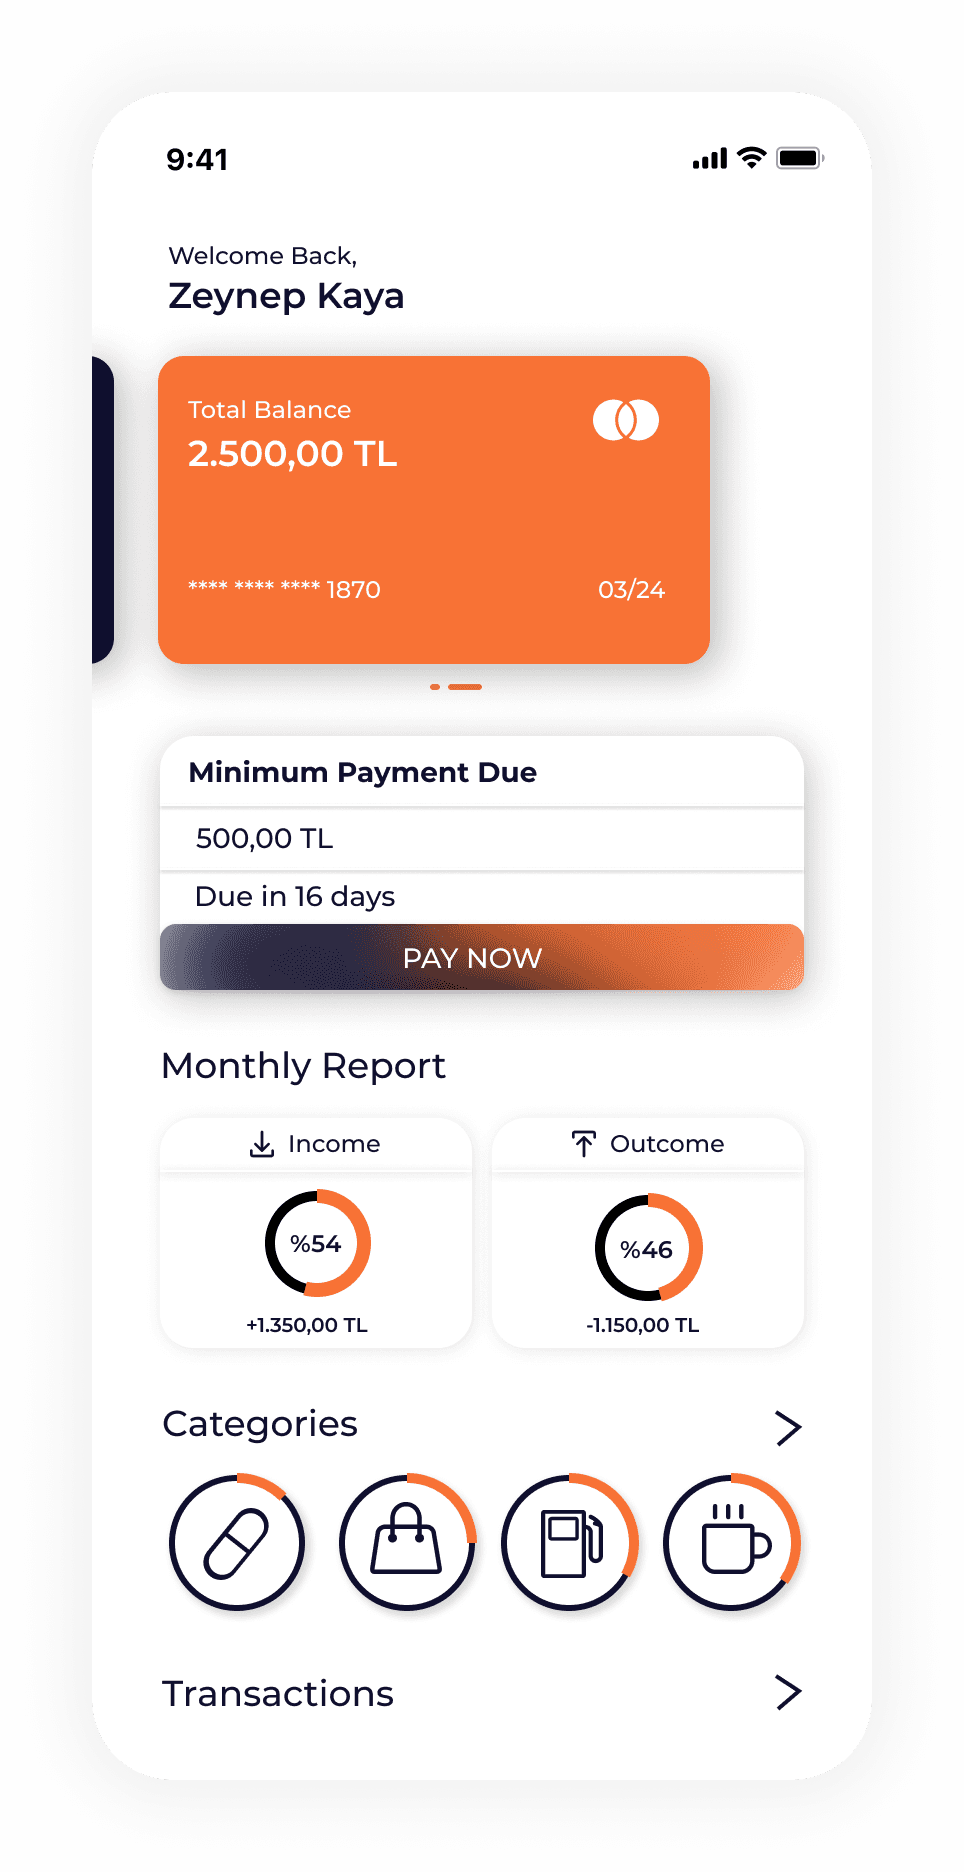
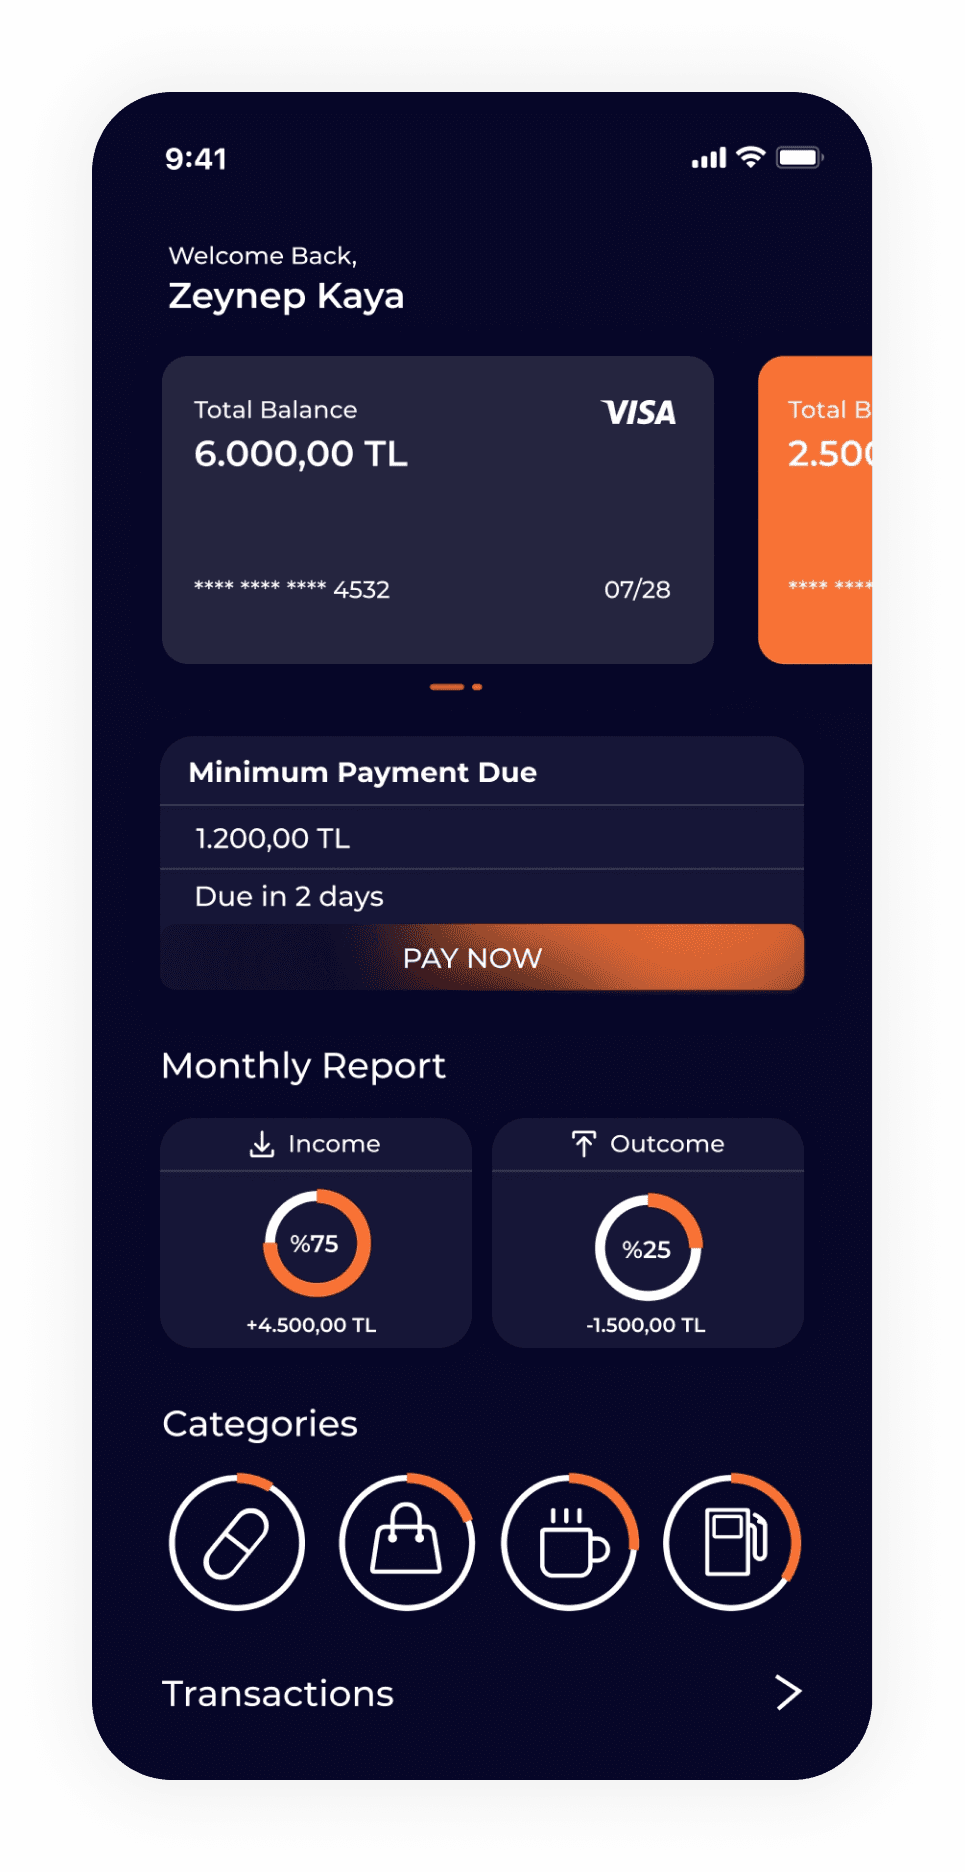
In the bustling realm of financial management, this app emerges as a guiding light, illuminating hidden insights and empowering users with newfound clarity. As the veil of ambiguity lifts, users find themselves welcomed by a homepage meticulously crafted to unveil essential yet often overlooked details. Swipe to navigate seamlessly between cards, where critical information like minimum amounts and payment dates take center stage, addressing users' yearning for clarity.
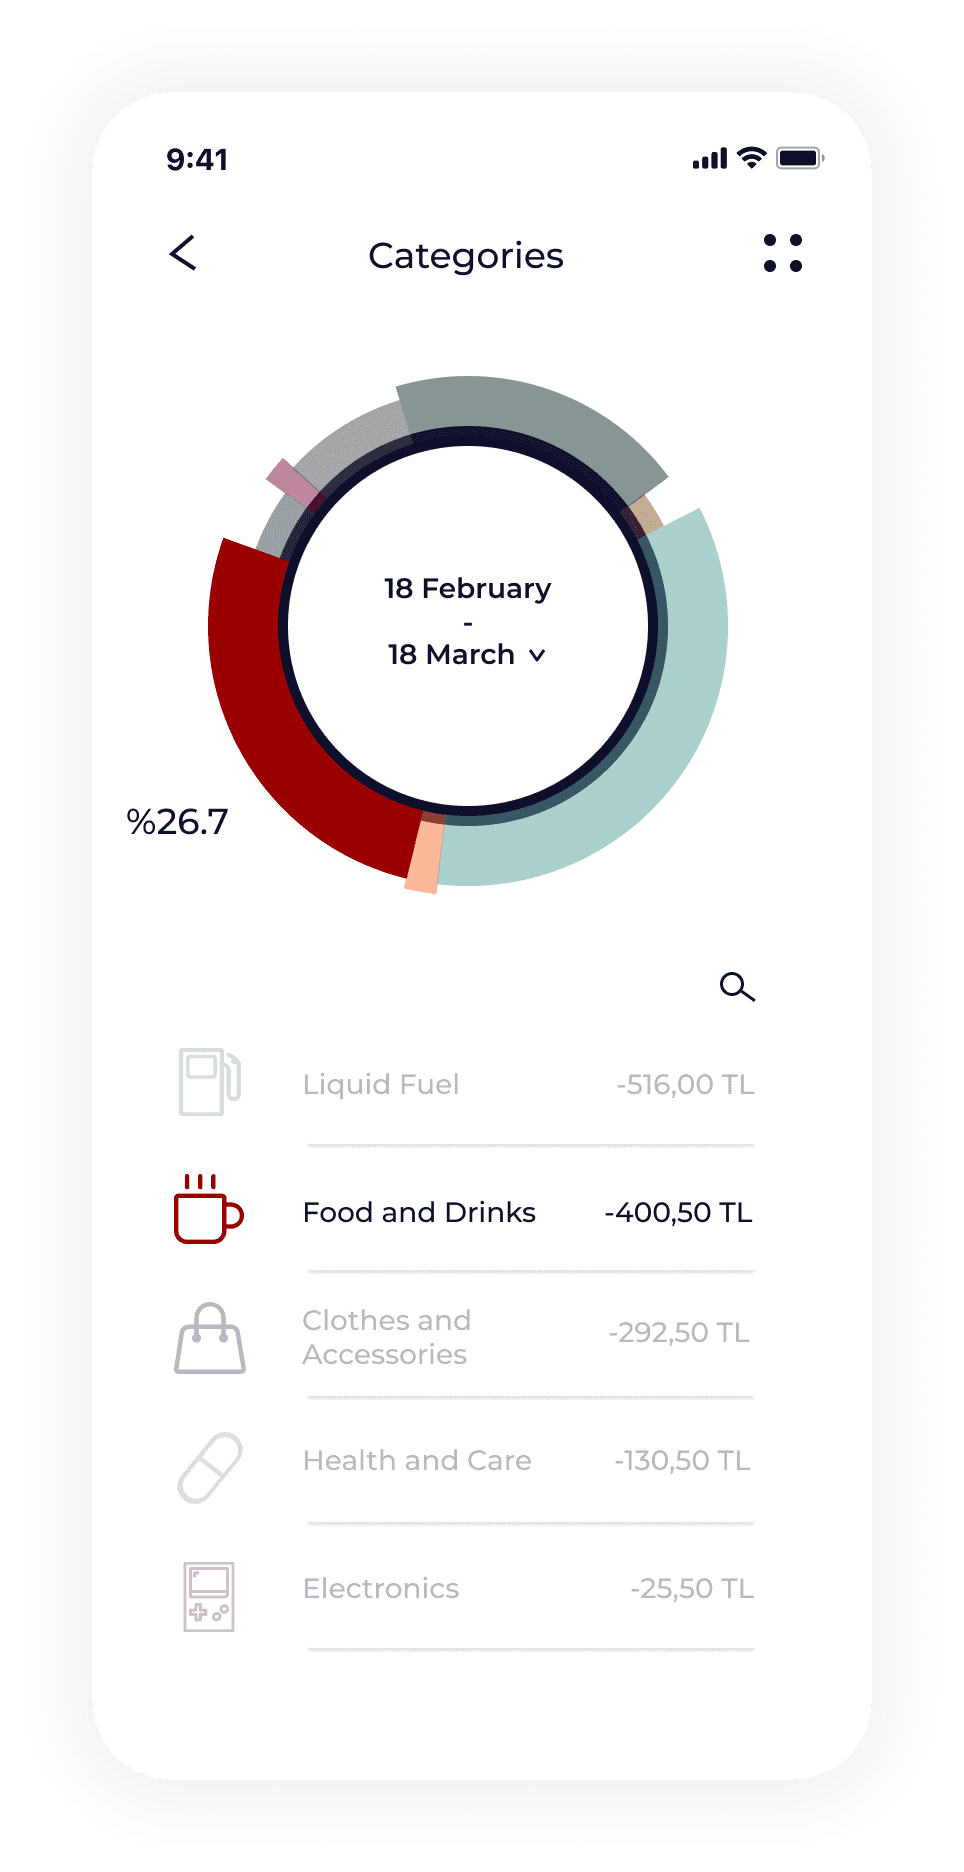
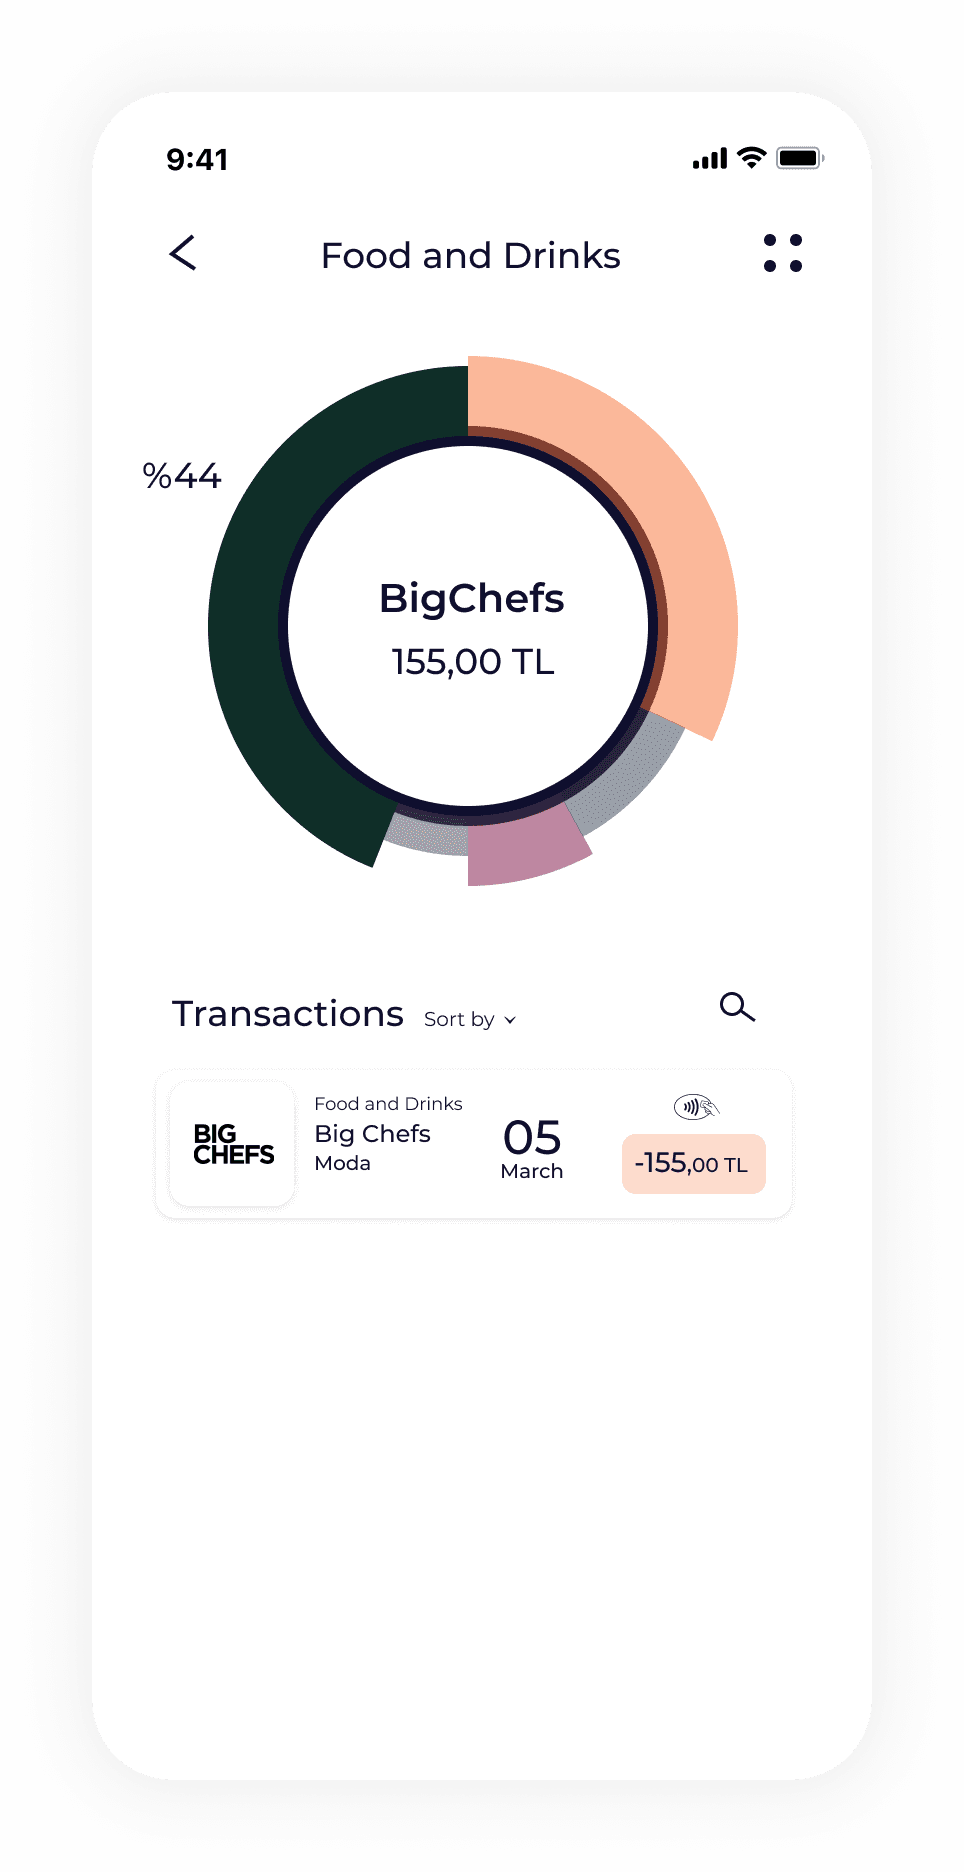
But the journey doesn't end there. As you click on the categories option on the home page, you can see the percentage and total amount you spent on which category with the pie chart. You can select the date range you want to see from the middle of the chart.
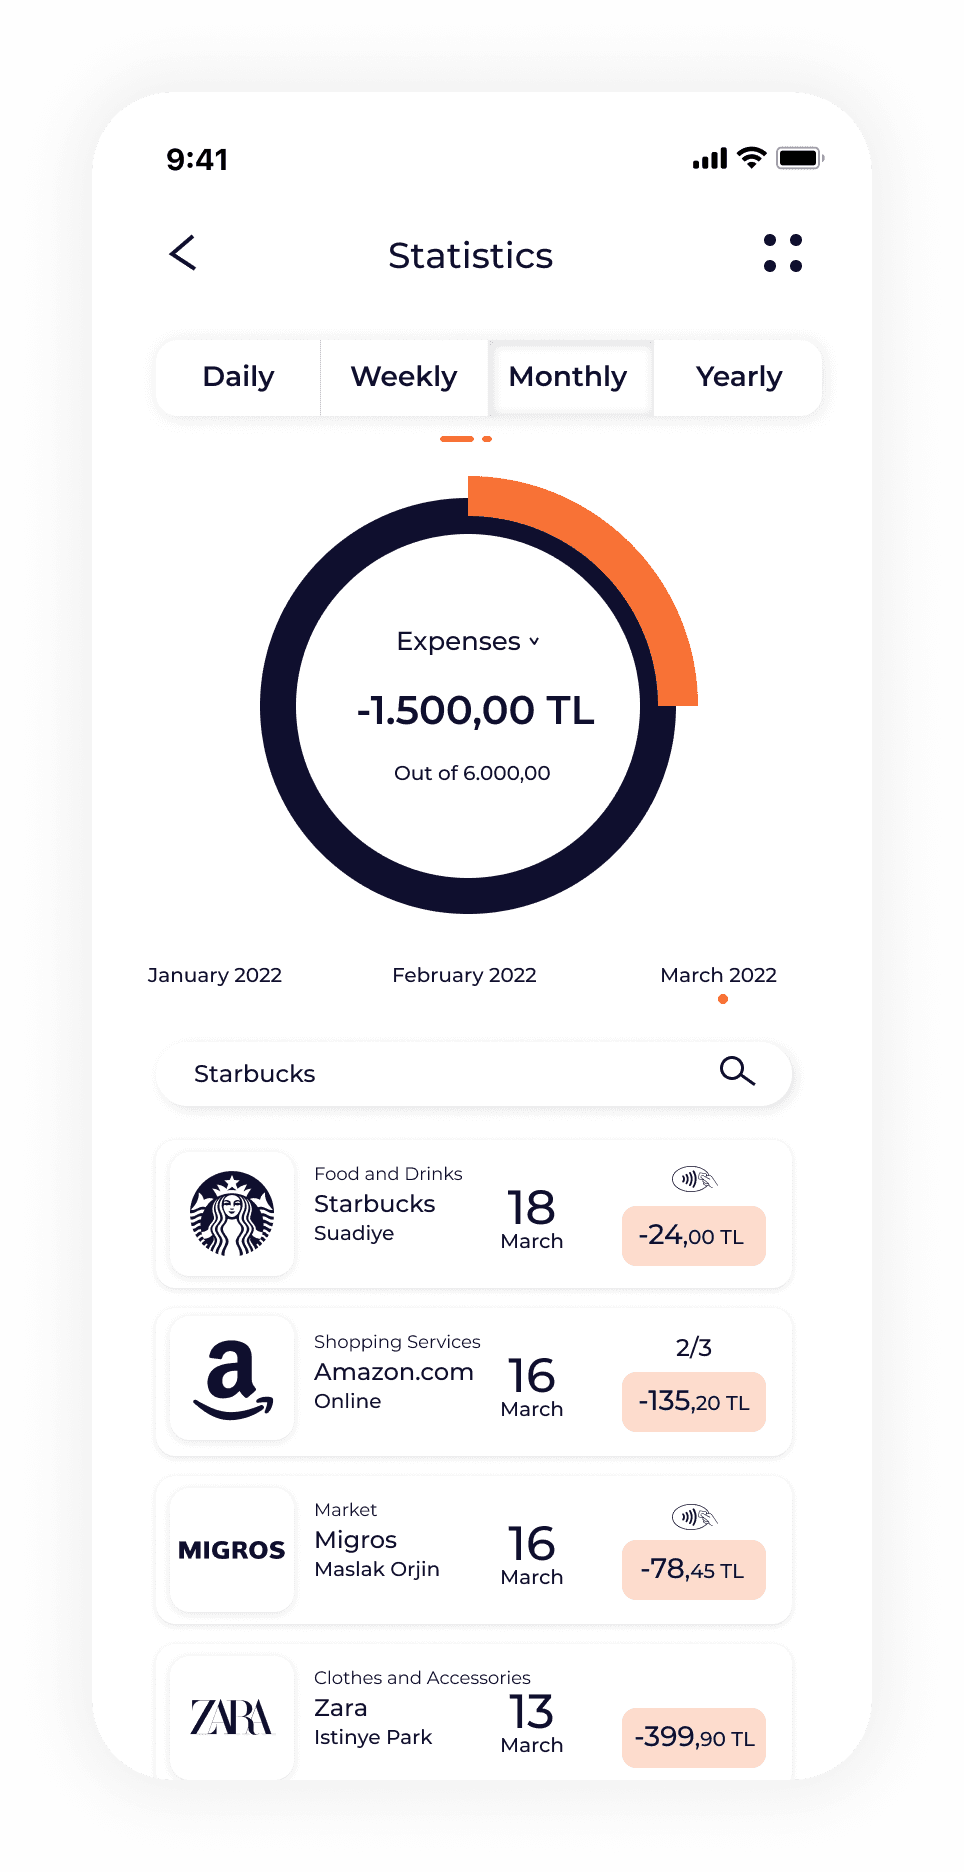
Venture further, and the transactions section unfolds like a personalized financial diary. Choose your perspective – daily, weekly, monthly, or yearly – and watch as your expenses come to life, each detail meticulously documented for your scrutiny. From categories to contacts, every transaction is laid bare, empowering users with knowledge.
When you slide the pie chart, a page opens where you can see your monthly expenditures by category.
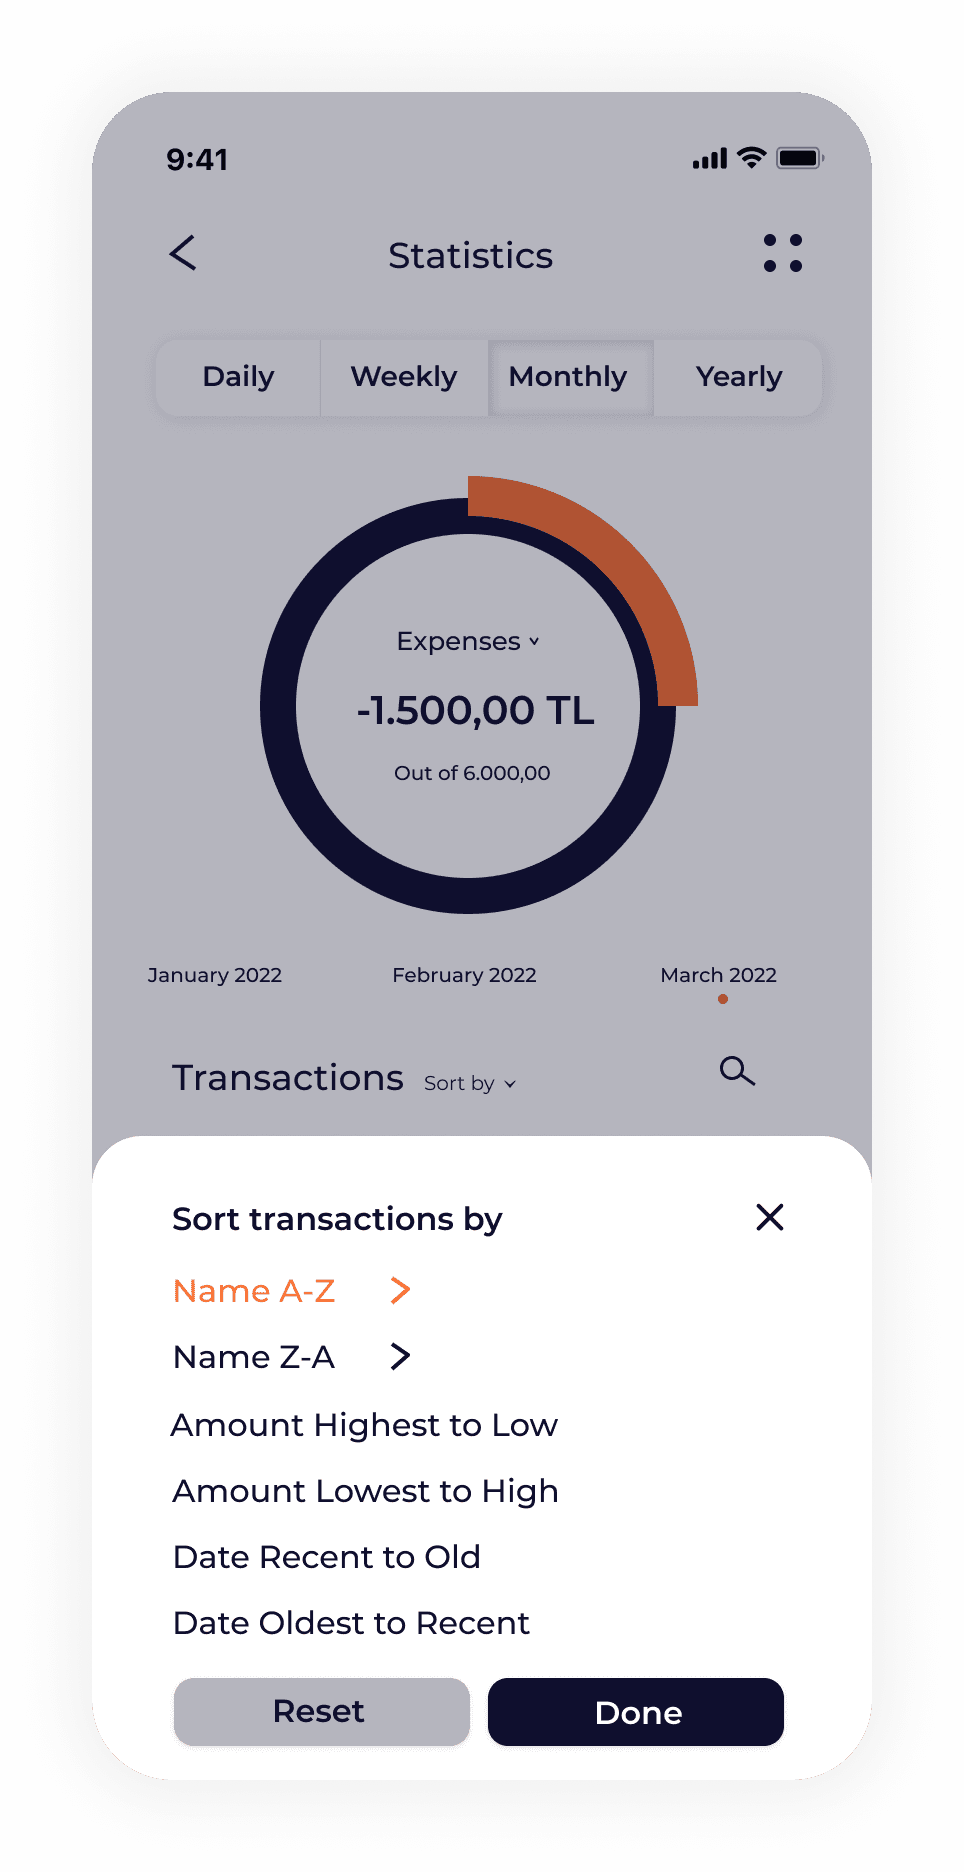
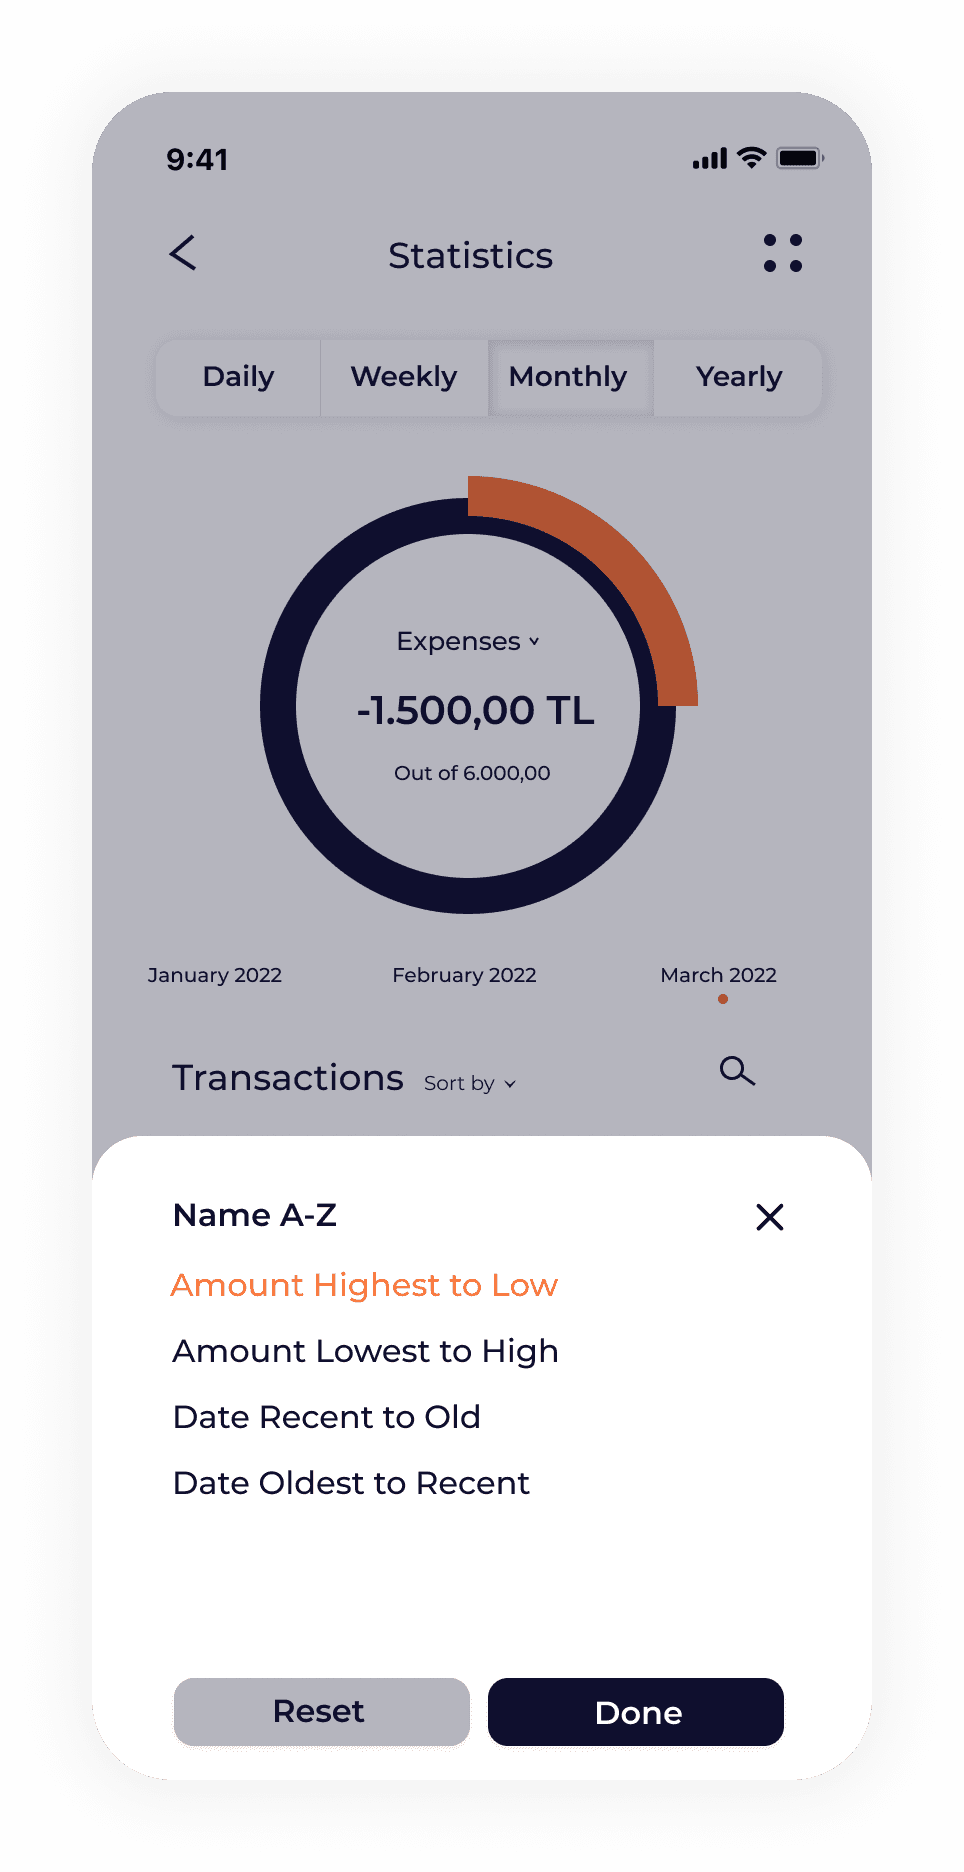
But what about customization? Fear not, for our app anticipates your every need. With sorting options tailored to your preferences and filters that align with your desires, finding what matters most becomes a breeze. Zoom in on brands, dissect spending by date and amount, or hunt down that elusive transaction with ease – the power is in your hands.
The options in the filters were also one of the most needed criteria as a result of my research.
According to the date and amount range selected in the filter, you can see how much was spent on which brand on the pie chart. Information can be easily accessed by clicking on the colors on the pie chart.
You can manually search for any brand, date, location, category or amount with the search button next to transactions section.
PREVIOUS PROJECT


